Digging deeper into xcbuild: Rules and Tasks
While debugging incremental builds for my work project. I came across this github gist by Daniel Dunbar who worked on the llbuild build engine for Swift and Xcode.
The llbuild build system was first introduced in Xcode 9 as an optional build system which devs could turn on and use if they wanted. Then in Xcode 10, Apple made this the default build system for all devs.
As of Xcode 12.3, the legacy build system is still available to be used, but is marked as deprecated by Apple
Apple has also announced, a successor to llbuild, called llbuild2(https://github.com/apple/swift-llbuild2)
Please note that this post targets compatibility with llbuild and has been tested upto Xcode 12.3. Future compatibility (with newer Xcode versions and llbuild2) is not guaranteed.
In this post, I will walk through how to enable the debug logs for xcbuild/llbuild and then briefly talk about how to understand those logs to figure out what could be causing rebuilds.
Enabling debug build flags
We are interested in the following commands from the shared gist on github
# Some minimal additional logging (this is safe to leave on).
defaults write com.apple.dt.XCBuild EnableDebugActivityLogs -bool YES

# Enable build debugging mode (safe to leave on, but slows down the build system & litters DerivedData/<project>/Build/Intermediates.noindex), generally should only be enabled when trying to capture a trace for incremental build debugging purposes.
defaults write com.apple.dt.XCBuild EnableBuildDebugging -bool YES
# You can also use:
env EnableBuildDebugging=YES xcodebuild -UseNewBuildSystem=1 ...
The comments above are to be heeded to. If you leave these flags turned on, expect your builds to become slower and the derived data folder size to keep on increasing over time.
I prefer to use the defaults write ... approach instead of launching xcode from command line, since I find it to be more convenient for successive builds over multiple days, where I quit and restart xcode mutiple times a day after many builds to reclaim xcode’s memory usage.
After executing the above commands, make sure you restart any already open xcode instances.
Finding the debug build logs
The debug logs are generated in the DerivedData folder for the project you are building.
Example path: /~/Library/Developer/Xcode/DerivedData/YourProject-identifier/Build/Intermediates.noindex/XCBuildData/buildDebugging-timestamp/build.trace
You can also find the path to this build.trace file in Xcode build logs. Try filtering for build.trace
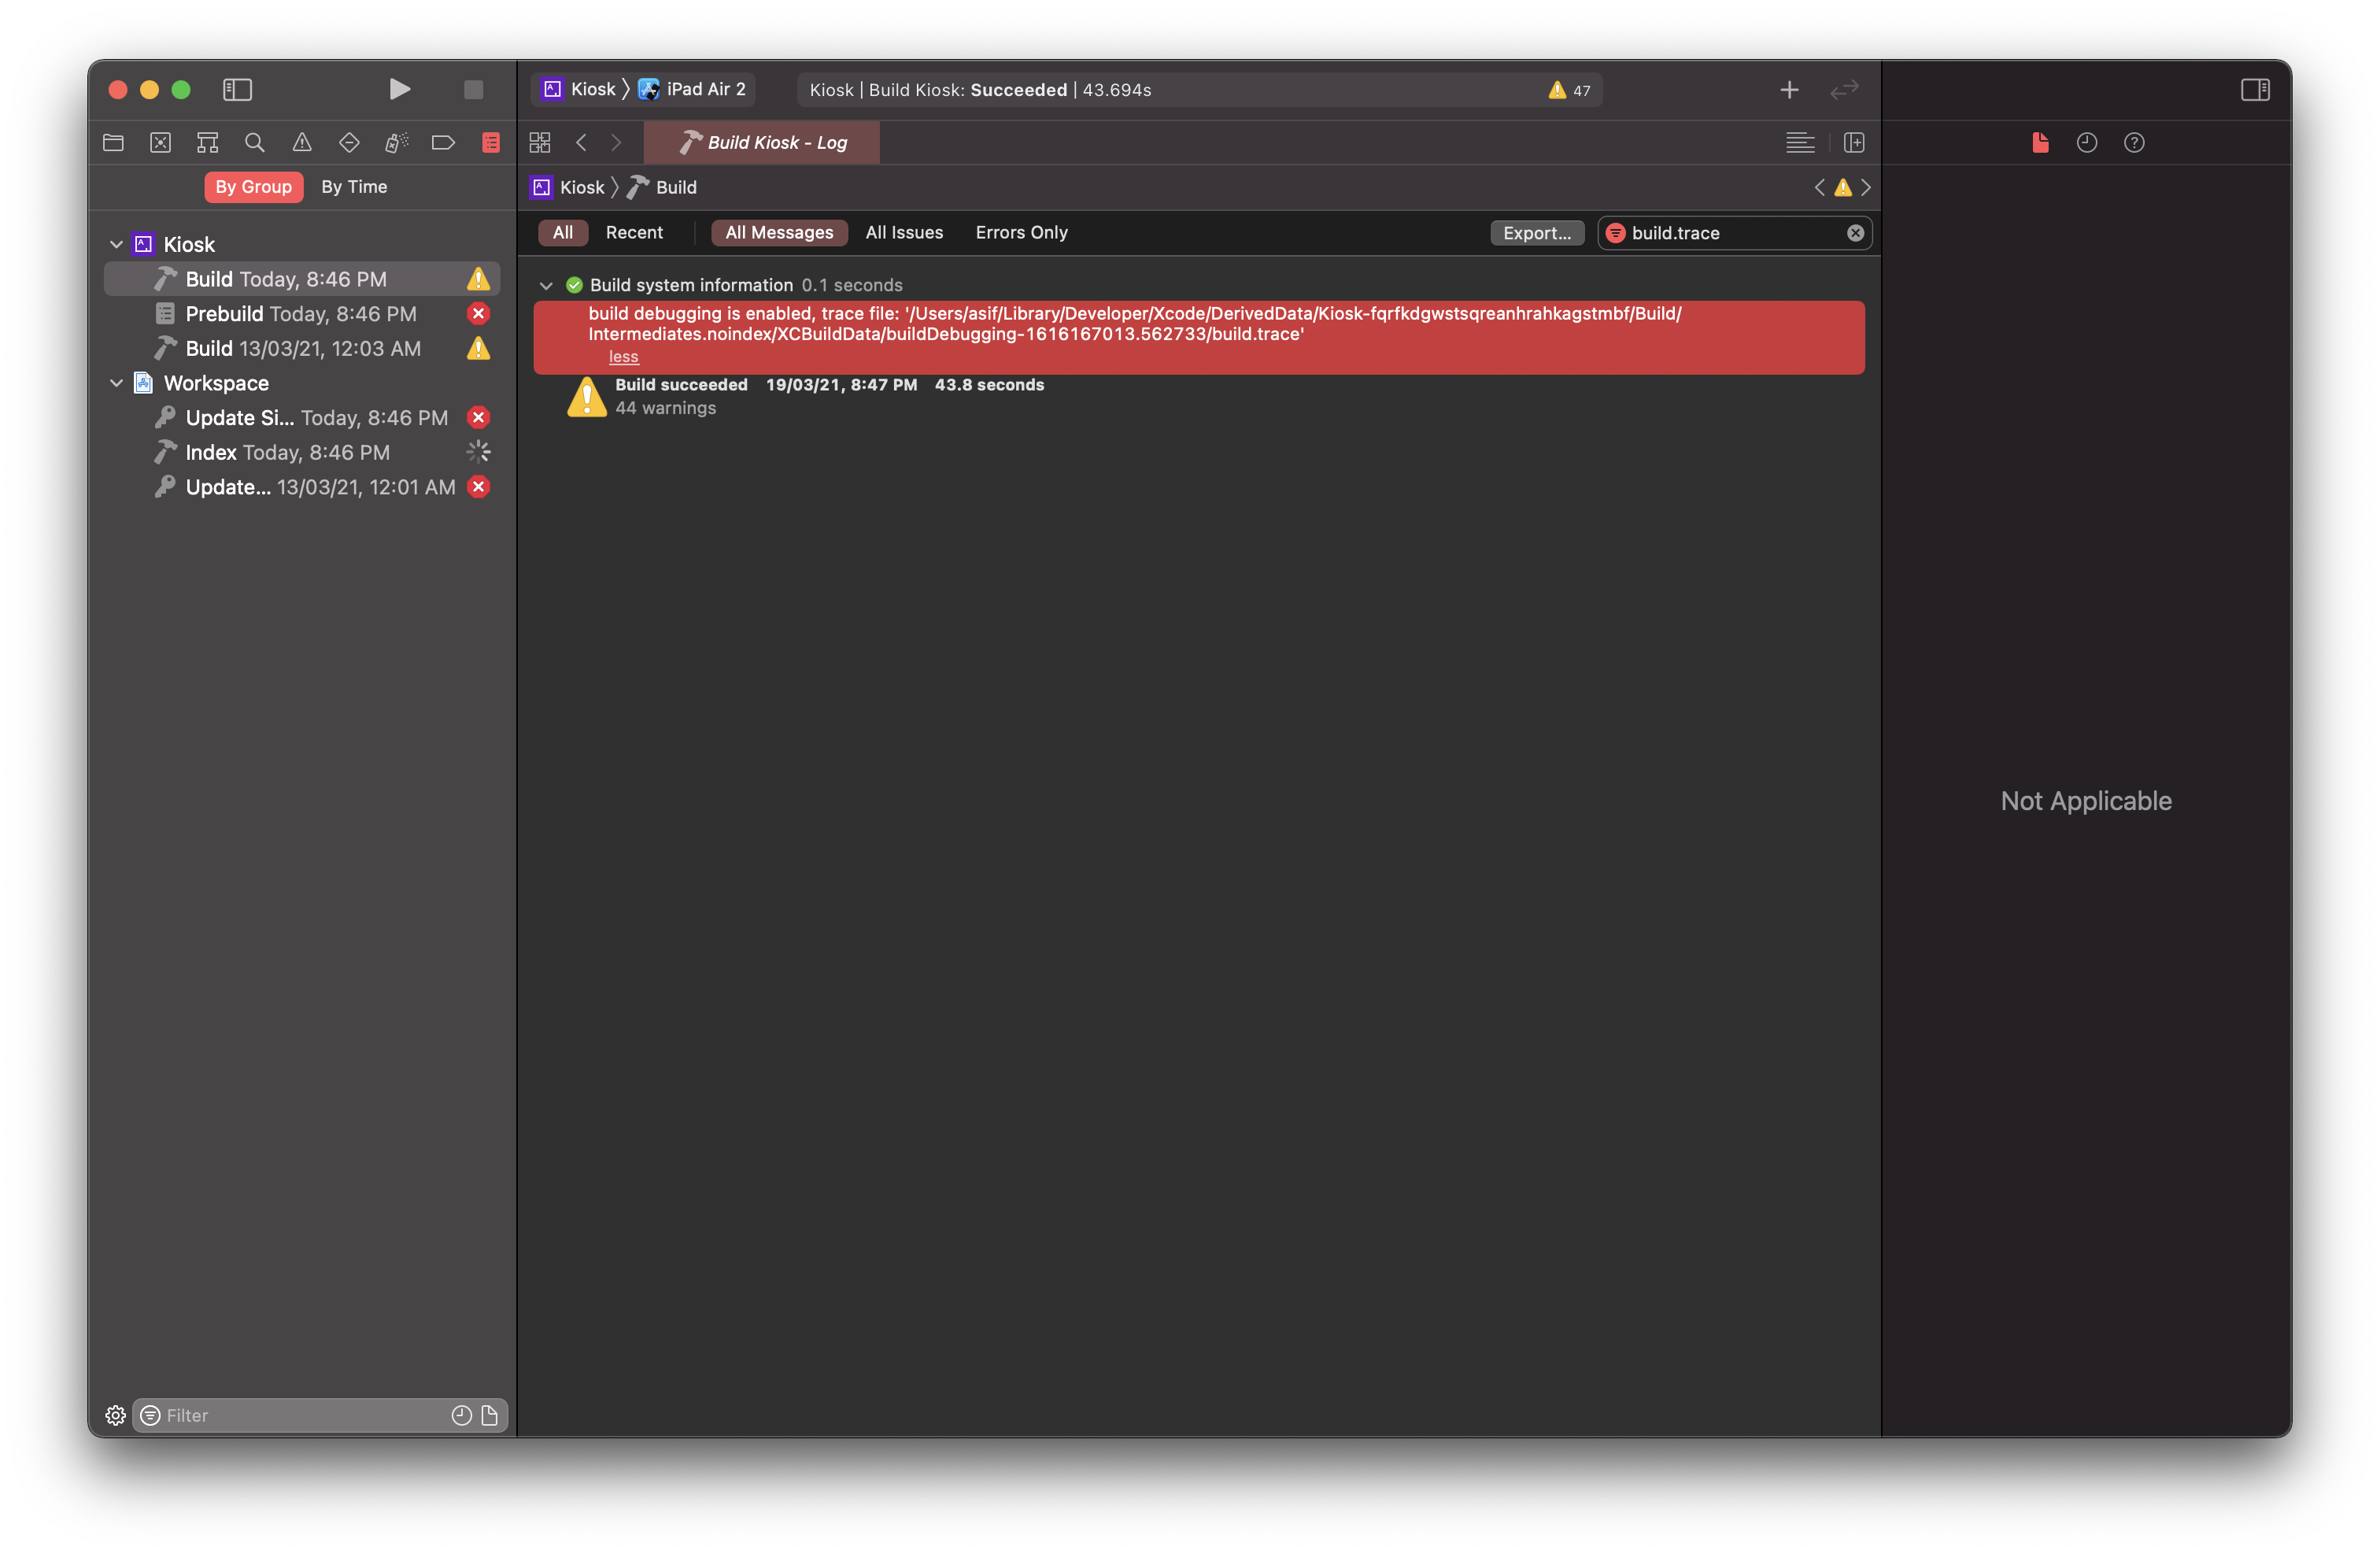
Note: We are using the open source eidolon project for the screenshots in this post.
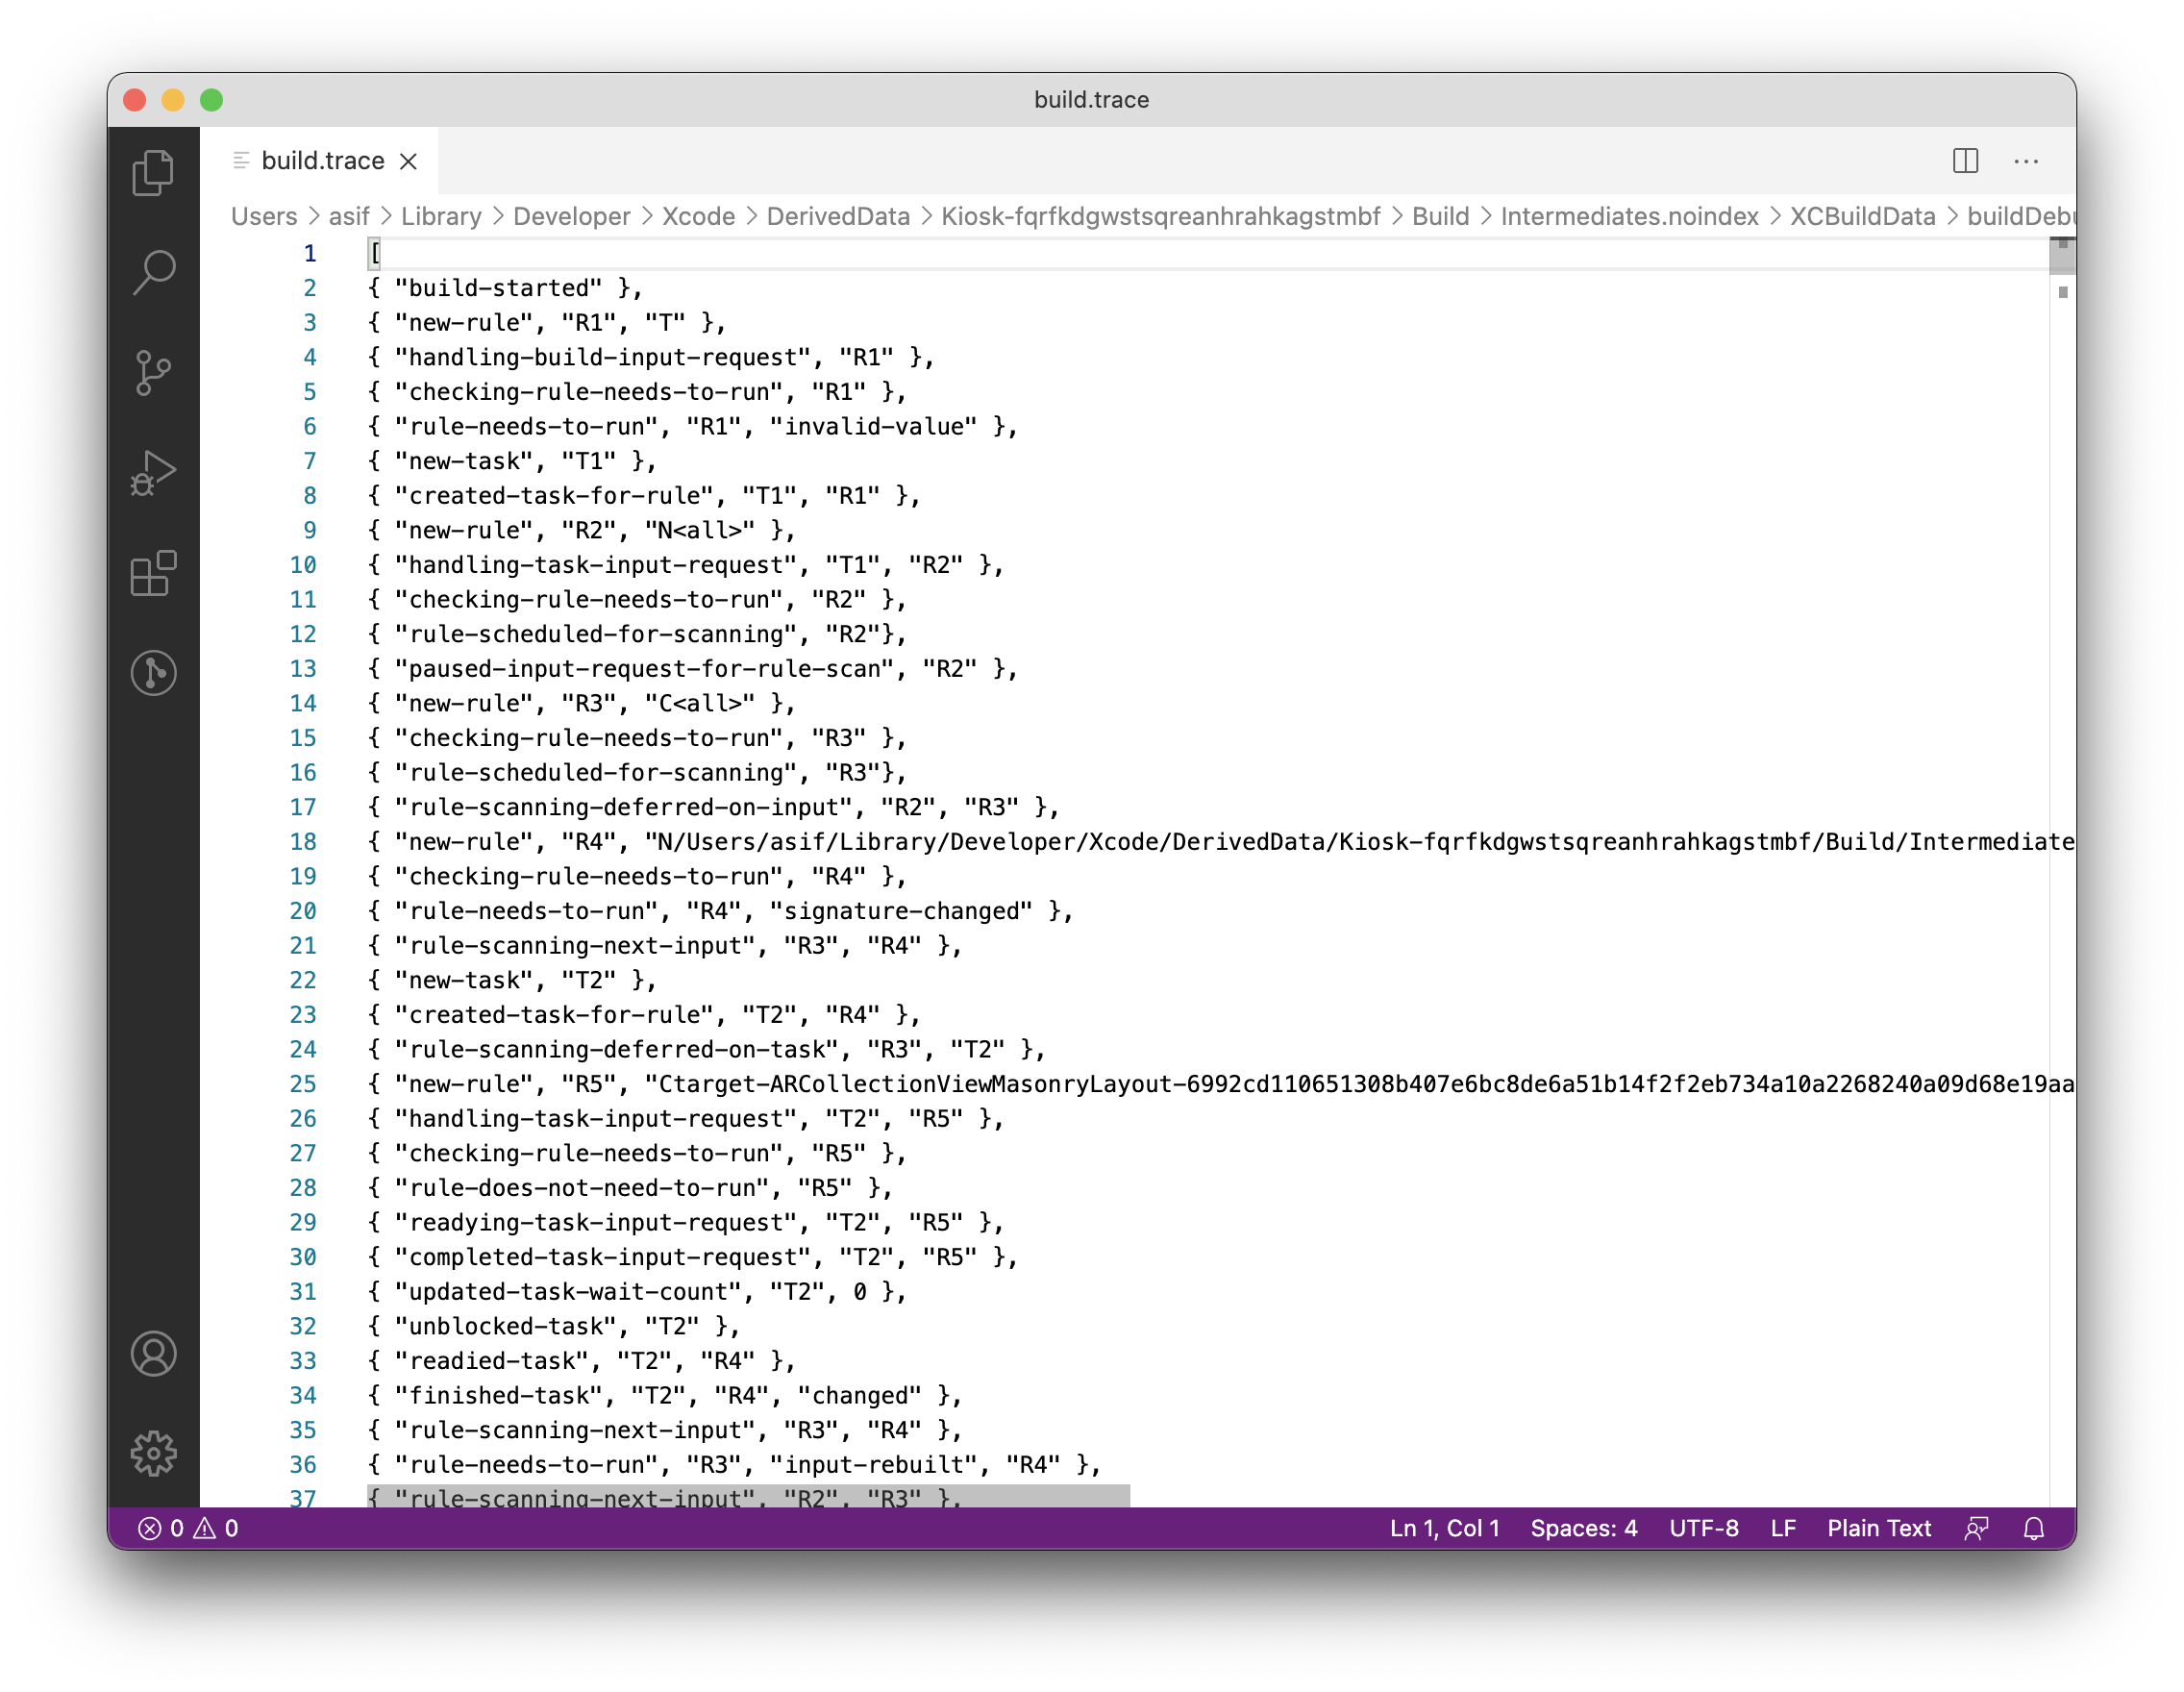
Open the build.trace file using any text editor.
Understanding the build.trace file
The build.trace file lists a set of rules and tasks.
Each rule can have a task associated with it. While each task must have a rule associated with it.
Any rule which reports as rule-needs-to-run, gets a task scheduled for it by the build system.
Generally, you will also find a mention of the reason, why the rule-needs-to-run in the adjacent lines in the trace. The reason can be listed as signature-changed or input-rebuilt and so on.
Debugging anomalies in the build
Say, you notice that on every build, a module called iOSStaticLib is being rebuilt.
You can follow these steps to try and identify why this is happening:
- Look for a rule with an entry for the
iOSStaticLib. You can also search forCompileSwiftSourcesin the same text file to try and find all such build phases where swift compilation is happening. - Once you’ve found the rules for the module in question, start digging by picking a rule and finding the reason it was set to
rule-needs-to-run. You can keep searching a particular rule id across the trace file to try to reach the parent for that rule or to reach the conclusion of that rule, i.e. whether it was set torule-needs-to-runorrule-does-not-need-to-run. - Keep looking for parents of rules, until you find a module/rule which highlights that it needed to be run. You can keep repeating this process to find out a module which is triggering rebuilds
Tip: Using xclogparser
Look into using xclogparser along with build.trace files to help you find modules which are being compiled on every incremental build with no code changes.
You can export a report in html represenation to identify which modules are being built and how long they take.
Meanwhile, you can also export a report in json representation that is more data rich, and in this json report you can look for modules which are being rebuilt by searching for fetchedFromCache : false in the JSON. This value being false, means the build system was not able to reuse the previously built artifact on an incremental build. Which is most likely an anomaly/misconfiguration in the build settings for that module. This can then become a good starting point for your team to dig deeper into build system issues and improve incremental build performance for everyone.
Tip: Run scripts and input/output file lists
Every run script that we add to a target, gets triggered on every build, even if there are no changes, unless we specify input/output file lists for that run script.
These run scripts are another good place to optimise your builds for even faster incremental builds.
These run scripts (i.e the ones without input/output file lists) will always show up as fetchedFromCache : false in xclogparser’s JSON output, and you will also be able to find rules and tasks for such scripts in the build.trace file
Case study
At my work, using the above techniques, we were able to isolate an anomaly in the build system.
Specifically, a module had overridden the FRAMEWORK_SEARCH_PATHS and had a recursive search path mentioned in this setting.
This meant, whenever a framework was built by the build system, this new framework was being passed to the module in the next build and that would trigger a rebuild of this module in the next build causing the second incremental build to take an equally longer time as the first clean build.
Using the rules from the build.trace file we were able to isolate the issue to this module, do an audit of build settings for this module and then remove the overrides to FRAMEWORK_SEARCH_PATHS. Further we were able to validate that the fix works by checking the new build trace files and noticing that the module and it’s related rules were not being rebuilt, as there were no tasks being created for the rules of this module.
With this one change in a single core module, we were able to save 10 mins of incremental build times for every developer in the company.